Introduction
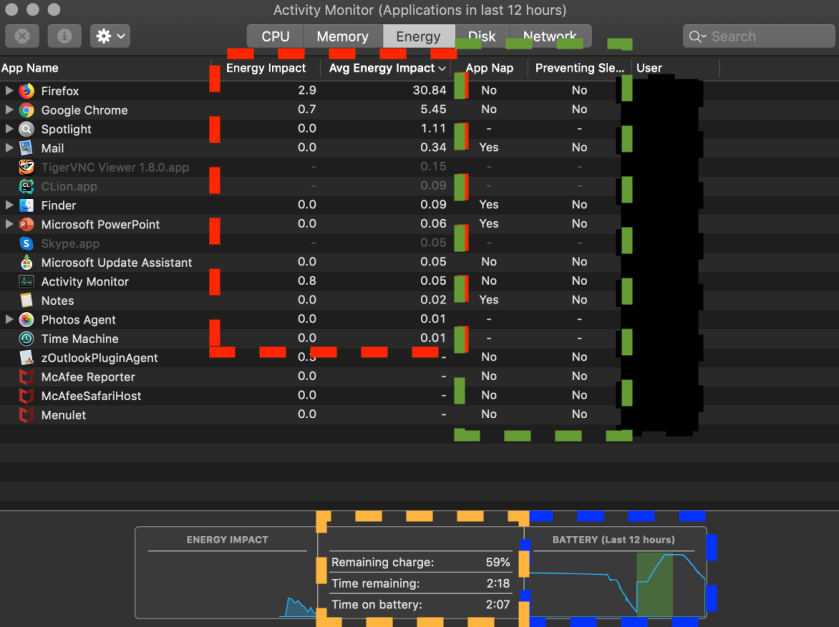
The Energy tab debuted in MAC OS Activity Monitor as part of OS X 10.9 (approximately six years old). It can be accessed by opening your Activity Monitor (pre-installed on every system) and clicking on the Energy button at the top (Picture shown below).
The tab displays the Energy Impact (red highlight in below image) of each current application (referred to as a process hereafter) based on several factors including CPU usage, network traffic, disk activity, screen brightness, etc. Higher energy impact implies a higher load on the system’s battery power consumption.
Energy Impact: A relative measure of the current power consumption of a process [7]. For comparison, lower numbers are considered better.
Avg Energy Impact: The average energy impact for the past 12 hours or since the system started up, whichever is shorter.
The value ranges from as low as 0 to an indefinite high (the highest value was observed to be around 780 while running the Geekbench stress test [5] ).
The energy impact value does NOT indicate the quantitative power consumption (for example, in milliWatts) of the application, akin to PowerTOP. Further, these numbers are not percentages and will not add up to 100. They are simply a unitless reference point, for comparison of energy efficiency among processes.
Apple has noted that since the introduction of these statistics, developers have become vary of code which causes unnecessary high-frequency wake-ups (for example, small animation loops running in the background with frequent updates to display buffers).
System Front end
Here we attempt to break down the information available in the panel:
- Center-right (green highlight): App Nap column indicates whether the process is currently sleeping (a process can be running on CPU, sleeping, or waiting for I/O, etc.).
Preventing sleep column indicates if the process is preventing the system from sleep. This information can also be obtained viapmset -g assertions # Displays current processes preventing system sleep
For example, if you happen to go out for a snack while working, you expect that the system will go to sleep on its own (a feature intended to conserve battery life). This happens via automatic timers based on your last interaction with the system (from input devices). On the other hand, if you are watching a movie, even though you are not interacting with the system, you don’t want it to sleep. Hence, the media player must indicate to the kernel to ignore the sleep timers, for the duration of the playback.
This information is critical as frequent wakeups are well-known to heavily tax the CPU power system, especially in the era of Dark Silicon.
- Extra columns (not visible in image): The system also measures additional information per process (CPU Time, CPU %, GPU Time, GPU %, Requires High Perf GPU, Idle Wake Ups, etc). These attributes can be displayed via right-clicking on the column names at the top. It seems that the system is measuring these attributes for each process as part of the kernel’s process accounting infrastructure (systemstats).
- Center-down (yellow highlight):
Apple acknowledges the fact that macOS is not great at determining energy consumption. Hence, they removed the remaining time from the menu bar icon. [6]
Although Apple does not display the remaining time in the menu bar, the number can still be observed inside this panel. It seems that Apple prefers a risk-free approach by not presenting such a fluctuating number to the majority of end-users. Remaining charge and time on battery metrics are more reliable and relatively straightforward to obtain (can be read from battery’s inbuilt counters and last charge time respectively).
- Bottom-right (blue highlight): This graph displays the battery’s charge availability over time. The graph slopes can provide useful information about current battery health (slopes indicate (dis) / charging rate, which degrades over battery’s life). An interesting observation is that the graph is quite smooth (seems to use a rolling average of battery charge as the basis, coupled with a large timescale of 12 hours).
System Back end
OS X is running a service called Powermetrics for all power measurements, and systemstats for process accounting and attribution.
Powermetrics is responsible for collecting data for each process by taking into account diverse factors such as CPU utilization, idle energy draw, network calls, the ability to keep the machine awake or wake it from sleep, disk activity, and combining them into a single reference number for per-process comparison.
I am guessing that at least some of the hardware power measurements come from the SMC chip embedded in the motherboard of Macbook systems. CPU power measurements are obtained via Intel’s hardware counters (RAPL).
Obtaining the statistics on your system
sudo powermetrics # Displays real-time statistics and system information
sudo /usr/bin/power_report.sh power.txt #Store the info in power.txt file in working directory
We can observe multiple statistics including CPU Time, Timers, Interrupts, Package and Core power states (if supported by underlying CPU), Disk Usage and Network Activity, Backlight levels, etc.
Interpreting the information
Guidelines for comparison [1]:
- CPU time, deadlines and interrupt wakeups: Lower is better
- Interrupt counts: Lower is better
- C-state / P-state occupancy: Higher is better (C7 consumes less power than C3)
The system uses device-specific regression parameters to combine powermetrics statistics into the single number displayed as the energy impact value [2]. Interestingly, kernel processes are exempt from this tracking, presumably to hide kernel’s energy consumption from the end-users. Since the computation is highly custom for each device (the regression parameters vary across product families and devices within the same family as well), the numbers are not comparable across devices. This implies the same process can have different power impact values across different machines!
As an interesting trivia, let’s try to answer the question: Why is Firefox / Chrome draining my MacBook battery? The reason is that Firefox and Chrome are not optimized to use the native hardware capabilities for tasks such as video decoding, and rely on software libraries for the same. This essentially translates to high wakeups for the CPU. Certain users have reported higher battery life (as high as 250%) by simply switching out Chrome for Safari (heavily optimized by Apple for native hardware execution, for example, for H.264 decoding) [5]
References
- https://www.unix.com/man-page/osx/1/powermetrics/
- https://blog.mozilla.org/nnethercote/2015/08/26/what-does-the-os-x-activity-monitors-energy-impact-actually-measure/
- https://apple.stackexchange.com/questions/96186/how-does-apple-calculate-the-energy-consumption-of-a-process-in-os-x-mavericks
- https://www.cmdsec.com/macos-performance-monitoring-collection/
- https://news.ycombinator.com/item?id=10120155
- https://apple.stackexchange.com/questions/107167/what-do-the-energy-impact-numbers-displayed-in-the-new-osx-10-9-mean-and-how-a
- https://support.apple.com/en-in/guide/activity-monitor/actmntr43697/mac
- https://support.apple.com/en-in/guide/activity-monitor/welcome/mac
- https://randomfoo.net/2013/11/08/more-on-os-x-mavericks-power-usage
Corrections and Feedback
In case of any mistakes / feedback, please feel free to reach out and let me know!
Thank you.
